

Heat maps
We said we would refresh the data on our generation and demand availability heat maps every month.
The creation of generation availability heat maps was an initiative that originated from the DG-DNO steering group, who encouraged DNOs to make more information about the connection capacity of distribution networks available to customers.
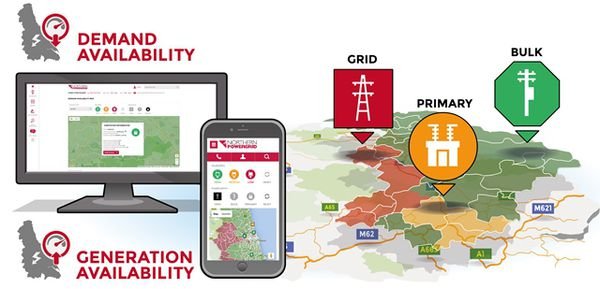
We embraced this request and over the years have developed an interactive online generation heat map that allows customers access to an extensive range of network information including; fault levels, voltage constraints, reverse power flow capabilities, physical constraints, numbers of quoted but not accepted schemes and numbers of accepted but not connected schemes associated with all of its primary substations. We were also the first DNO to launch a heat map for our demand customers.
The accuracy of the information available within the heat maps is important for customers if they are to use the tool effectively. We understand that customers want the most accurate and up to date information available. In response to their feedback, and following a comprehensive assessment where we considered six monthly and quarterly updates that would see us align with what others in the industry were doing, we decided that a monthly update would deliver the most benefit for our customers.
We made the first of our monthly updates in June 2016. Having met the initial target we embarked upon the process and system changes necessary to embed this into business as usual. That work highlighted some weaknesses, which we moved quickly to rectify and we now have a robust process that enables the data on our generation and demand heat maps to be updated every month.